Portfolio Management Tool
On the basis of a sample portfolio, this dashboard presents the results of all relevant analyses. Expect an optimized sample portfolio with each new analysis, as well as new graphics and tables.
Disclaimer Please, for your own sake, DO NOT under any circumstances base your investment decisions on this research project. It is a purely academic project based on outdated data. Do your own research or consult an investment professional.
Code: If you are interested in the underlying mechanics of the analyses and data collection, please have a look at the jupyter notebooks on my github repo and read through the other articles of this blog series.
Overview
Sample portfolio composed of iShares Core Series with the intent of a global diversification. There are no further assumptions or restrictions applied to creating this portfolio, yet.
Assumptions:
- 100.000€ Cash available for investments
- Transaction Costs according to Consorsbank model (see code for details)
Stats
99,633€
274€
93€
Portfolio
| ISIN | Name | Acc / Dist | N | Value | Dist Last 12M | Dist in % |
|---|---|---|---|---|---|---|
| IE00B4L5Y983 | iShares Core MSCI World UCITS ETF | Acc | 283 | 19,913 | - | - |
| IE0031442068 | iShares Core S&P 500 UCITS ETF USD (Dist) | Dist | 531 | 19,912 | 231 | 1.16 |
| IE00BKM4GZ66 | iShares Core MSCI EM IMI UCITS ETF USD (Acc) | Acc | 721 | 19,928 | - | - |
| IE00B1YZSC51 | iShares Core MSCI Europe UCITS ETF EUR (Dist) | Dist | 696 | 19,944 | 475 | 2.38 |
| IE00B4L5YX21 | iShares Core MSCI Japan IMI UCITS ETF USD (Acc) | Acc | 522 | 19,937 | - | - |
| Total | 99.633 | 706 | 0.71 |
Value over time
Change in value of the portfolio over time, normalized to most current period. With the black line represting the closing prices of each trading day, and the red shadow indicating the daily spread between highest and lowest prices.
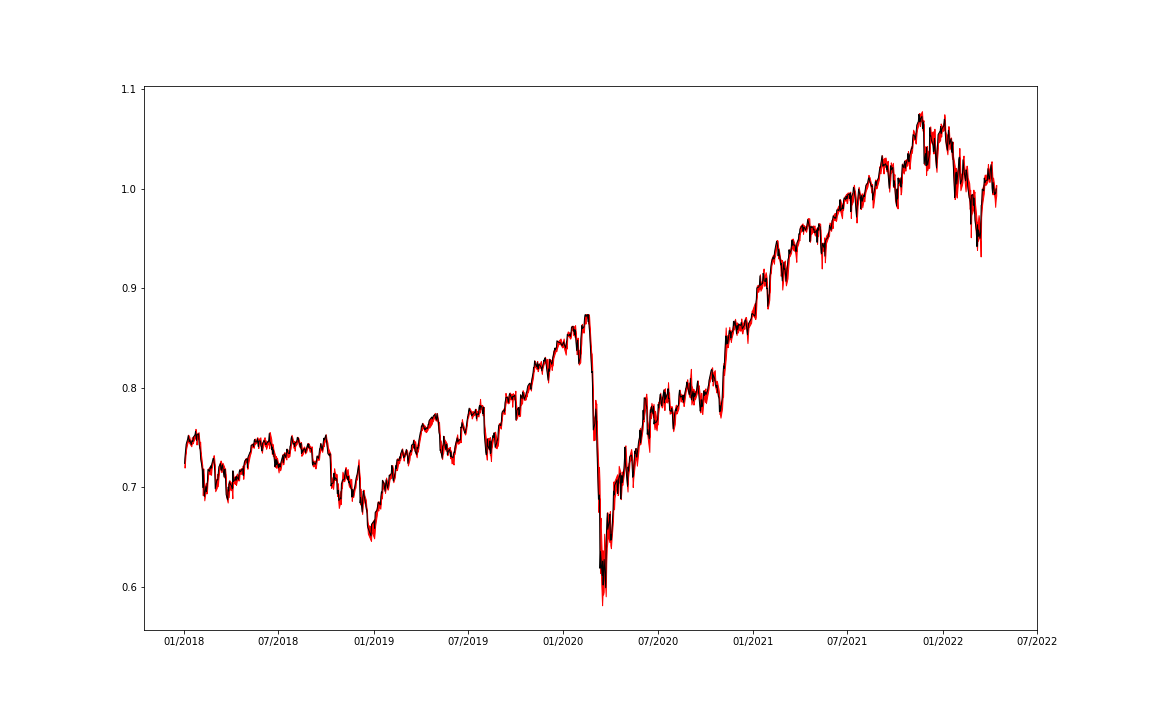
Comments:
- The portfolio was bought some time ago, s.t. the portfolio holdings have the specified portfolio weights today.
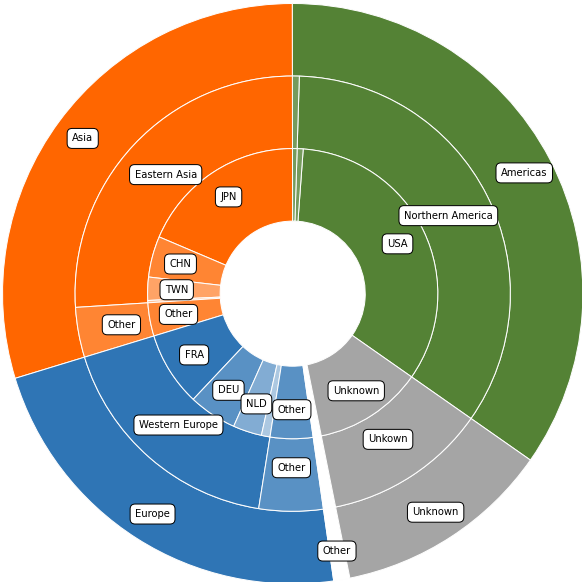
Diversification
Regional diversification of the portfolio holdings at a specific date. The portfolio seems reasonably diversified when looking at regions. Within regions, there is a very high concentration on companies from the USA and Japan.
Diversification by Region
\
Top 10 Holdings
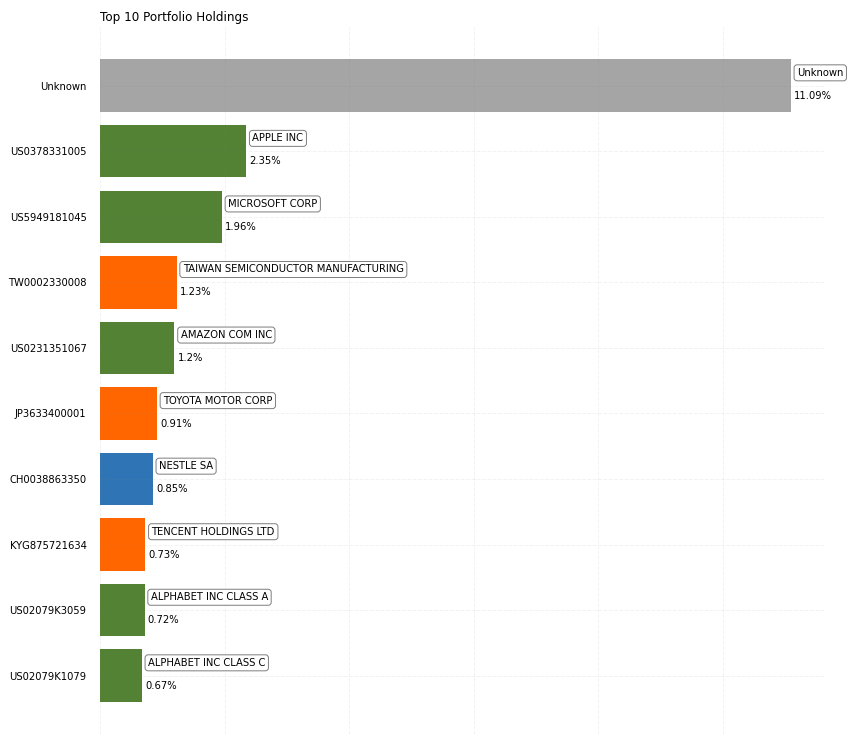
Comments:
- The country corresponds to the headquarter of the company. It does not mean that it is also the country where most of the revenue/profit is created. That is a topic for future analyses.
- The category “unknown” is a mapping problem. This requires a better data quality process for mapping iShares holdings to an ISIN.