Measures of Similarity
The name and description of ETF-products gives a good idea of the actual underlying investments. Though, both do not provide guarantees and can be misleading. In the end, only the actual holdings matter.
This exact problem was identified by Sakakibara et.al. for mututal funds 1. For a selection of Japan focused mutual funds, they analyzed the similarity of the top 10 holdings. And found that fund categories and presented strategies can be different from the actual operations of mutual funds.
In the following, we will have a look at ETFs and two measures of similarity. After a visual inspection with a network graphic, a data-driven method is applied, namely a kMeans Cluster Algorithm. The results of the clustering algorithm are then visualized with a word cloud of the names of the ETFs in each cluster.
Measures
The problem of measuring similarity is also one of measuring dissimilarity. Which is the distance of two points in a multidimensional metric space.
Measures of distance can be developed on security level, but also on aggregated levels like country or industries. Analyses on aggregated levels will be caught-up as soon as the country and industry mapping is clean.
For this analysis, we will have a look at two measures:
- The number of common securities in the top 10 holdings
- The sum of common portfolio weight
The first measure simply counts the number of same securities appearing in the top 10 holdings of two ETF-products. It will therefore be a number between 0 and 10.
The sum of the common portfolio weights compares the weights of all securities across two ETF-products. For each common security, the common portfolio weight is the minimum of the two weights. It is therefore a number between 0 and 1.
Visualization
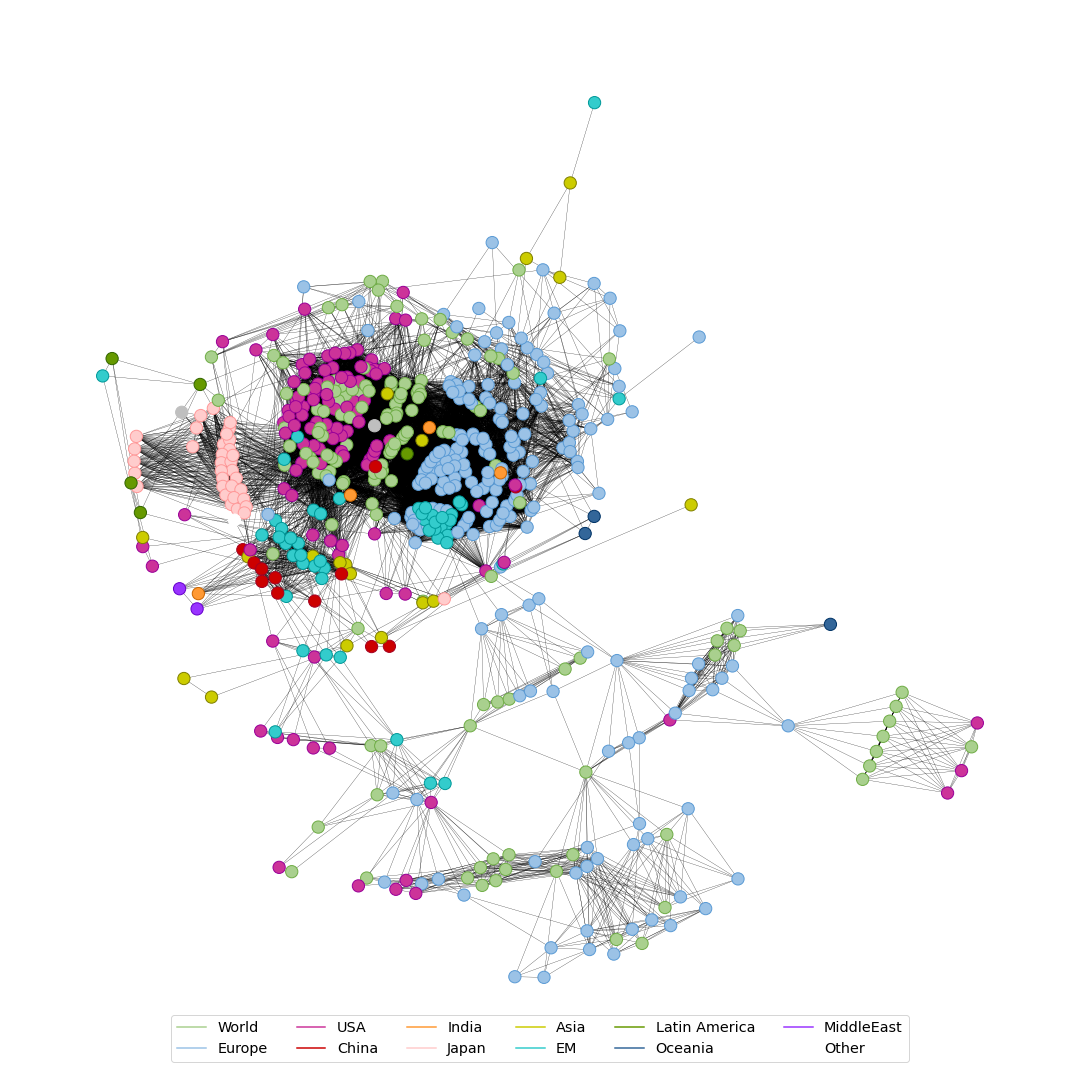
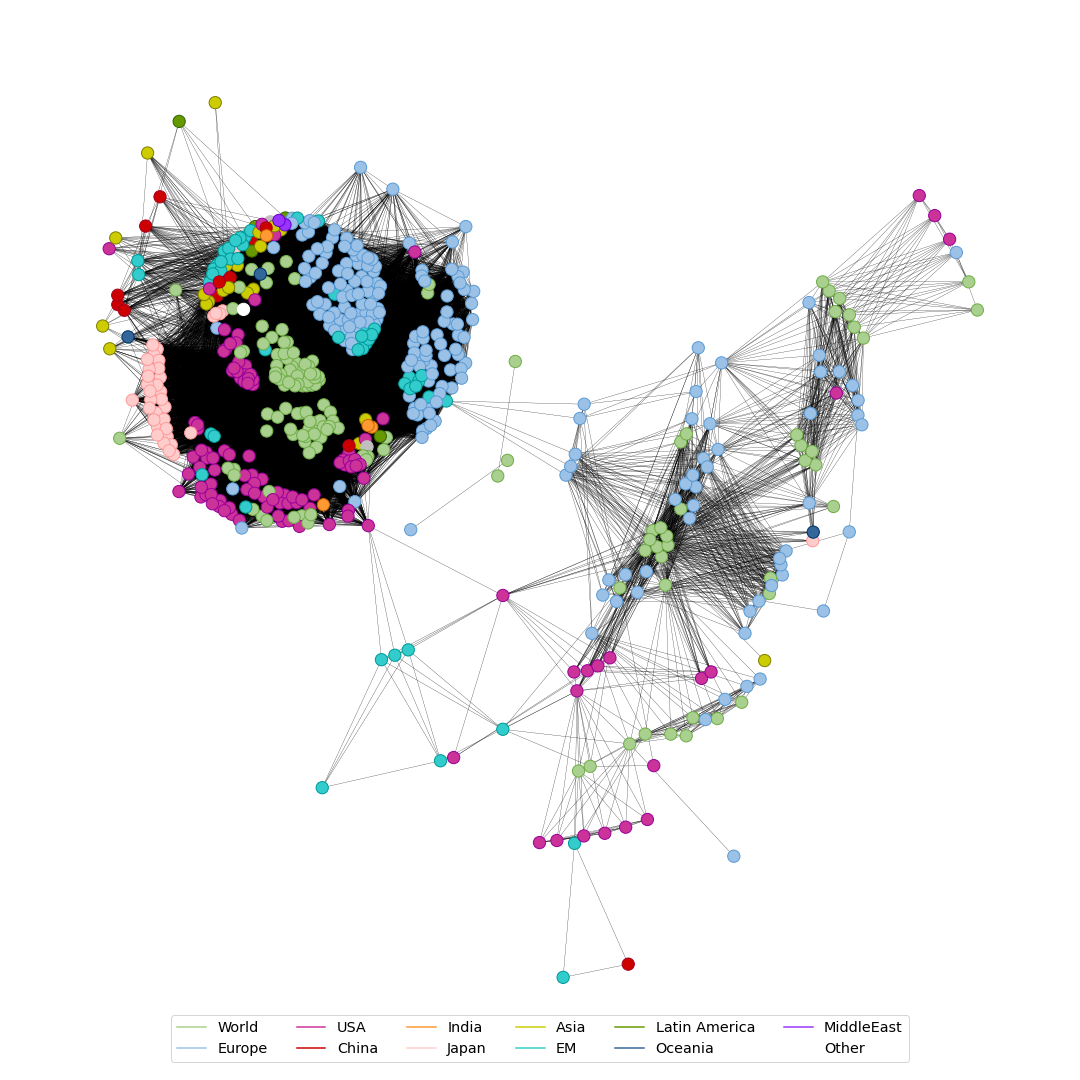
Our measures provide a distance for each ETF-product to each other one. This relation is best visualized with a network.
For each measure, we will visualize the relevant similarity, i.e.
- at least 1 common security in the top 10 holdings
- a minimum of 1% of common weight
Further, I manually assigned topics to each ETF-product only taking the name into account. For example, an ETF tracking the S&P500 is assigned to “USA”, whereas another tracking the “Euro Stoxx 50” is assigned to “Europe”.
Both network graphics identify two distinct areas: a more crowded one with equity-focused ETFs and a sparse, less-connected one with a focus on bonds. Though, both areas are likely to be connected over mixed equity/bond ETFs.
Further, we can observe a close proximity of US-products with those suggesting to cover the whole world. Also, there is a very distinct cluster for Japanese equities.
For the European funds, there appear to be two subgroups. One is closer to the US and world-wide funds. Whereas another one is closer to Emerging Markets. Which makes sense, as Europe spans from the developed western countries to emerging markets like Russia.
Network of number of common top 10 holdings
Network of sum of common weight
Data-driven clusters
The visualization showed that the manual assignment of topics works well. For a purely data-driven approach, we will apply a kMeans clustering algorithm.
This method of unsupervised learning partitions the data set into a predefined number of distinct clusters by minimizing the within-cluster variance on a measure of distance. For this analysis, the distance measure will be the sum of common portfolio weight, as defined and analyzed further above.
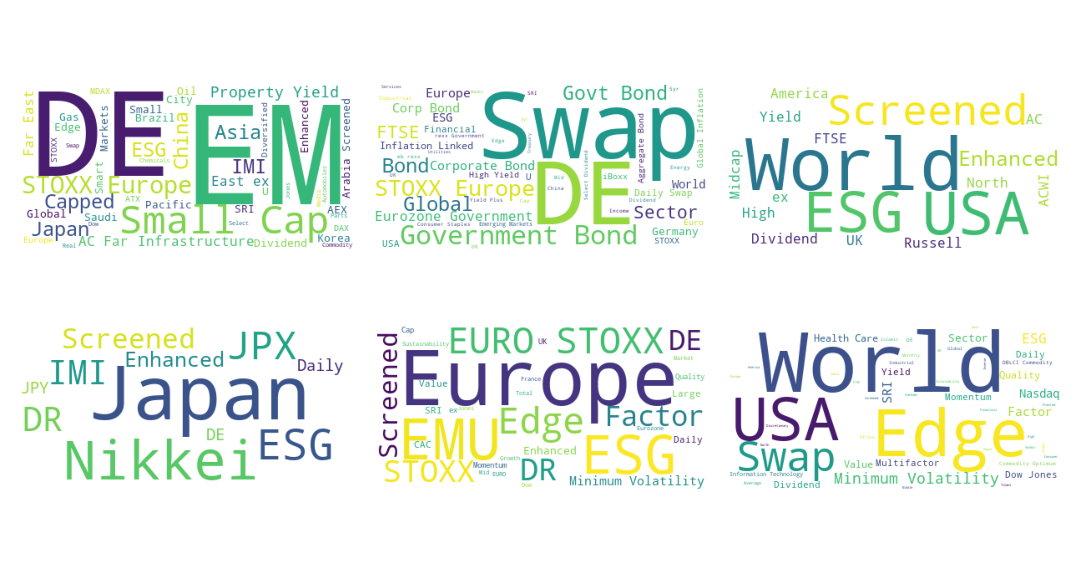
Following the elbow method, the optimal number of clusters is at least 5. For aesthetic reasons, I choose 6 clusters.
The word cloud shows, for each cluster, the most common terms in the names of ETF-products. The 6 clusters can be summarized as follows:
- Emerging Markets
- Bonds
- World and USA - ESG and Screened
- Japan
- Europe
- World and USA - Topics
I find it most peculiar that there is a separate cluster for Japanese ETFs. It must be mostly disconnected from all other ETF-products. Also, there must be many products for the algorithm to create a separate cluster. Meaning, Japan must be the most interesting single market in asia for ETF-products.
Outlook
While this analysis provides a good insight into how similar most ETFs are, this is just a starting point.
A natural next step is to assess the distance of a sample portfolio to the clusters identified in this analysis. Stay tuned.